
Center of Mass and Center of Rigidity: Where to Find Them in ETABS, SAP2000, and Towers
The center of mass (CM) and center of rigidity (CR) are two key parameters that every structural engineer designing buildings in seismic zones must document at some point. Both are directly available in CSI software, but in different locations depending on the program combination used. This article clarifies what each parameter represents and shows exactly where to find it across three scenarios: ETABS, standalone SAP2000, and SAP2000 with the Towers plugin.
.png)
Figure 1: Floor 1 plan of the building used in the examples, showing the position of the CM and CR. The center of mass is located near the geometric center of the floor plan; the center of rigidity is shifted toward the shear walls.
The figure above illustrates the central concept of this article. The mass is distributed fairly uniformly, placing the CM near the geometric center. The lateral stiffness, however, is concentrated in three distinct areas (the 7.4 m wall along the bottom edge, the 9 m wall on the left edge, and the U-shaped core in the center). This shifts the CR toward (14.82, 2.81), over 7 m away from the CM in the Y direction. This distance generates torsional effects under seismic action, which Eurocode 8 requires engineers to quantify.
Why We Need the CM and CR
In a 3D finite element analysis, the actual eccentricity between mass and stiffness is automatically included in the results: the structure twists because the stiffness matrix and mass matrix dictate it, without requiring additional user input. Therefore, the CM and CR are not used to "correct" the analysis.
Their primary purpose lies in regulatory compliance checks and structural behavior interpretation, specifically:
- Plan regularity: EN 1998-1, §4.2.3.2(6), requires that at each story and in each direction, the structural eccentricity satisfies e0 ≤ 0.30·r and the torsional radius satisfies r ≥ ls, where e0 is the distance between the CR and CM, r is the torsional radius, and ls is the radius of gyration of the story mass in plan.
- Classification of torsionally flexible systems: §5.2.2.1, with direct implications for the behavior factor q.
- Accidental eccentricity: The ±5%·Li displacement required by §4.3.2 is applied relative to the story center of mass.
- Design diagnostics: A large CM-CR distance flags a poorly distributed lateral system in plan, causing torsional effects that result in heavily loaded corner columns.
Definitions and Formulations
Center of Mass (CM)
The CM is the centroid of the story mass. It depends exclusively on the mass distribution (self-weight, permanent loads, and the quasi-permanent fraction of live loads set via the Mass Source) and is independent of stiffness and lateral loads. In each direction, it is calculated as a weighted average:
xCM = Σ(mi · xi) / Σmi yCM = Σ(mi · yi) / Σmi
Center of Rigidity (CR)
The CR is the stiffness centroid of the diaphragm: the point where an applied horizontal force causes pure translation of the diaphragm without any rotation. Because it is a property of the structure, it is independent of the load pattern.
ETABS and Towers determine it by solving three unit load cases for each diaphragm at an arbitrary floor point: a unit force along global X (causing rotation Rzx), a unit force along global Y at the same point (causing Rzy), and a unit moment around global Z (causing Rzz). The coordinates of the center of rigidity are then:
XCR = − Rzy / Rzz YCR = Rzx / Rzz
|
Note that in a multi-story building, behavior is coupled in both plan and elevation: while calculating a story's CR, all other stories remain free to translate and rotate. The resulting CR is therefore a story-by-story property of the complete model, not the result of an isolated frame calculation.
The examples presented below were obtained from the same building modeled in both programs: a 12-story reinforced concrete building with columns, beams, slabs, shear walls, and rigid diaphragms assigned to all floors.
What Each Combination Provides
| Combination | Center of Mass | Center of Rigidity | Additional Output |
| ETABS | Yes: in the same table as the CR. | Yes: in a dedicated table, provided rigid diaphragms are used and the calculation option is pre-enabled. | Story mass, cumulative mass, cumulative center of mass, story response tables, and charts. |
| Standalone SAP2000 | Yes: in the .OUT file, whenever rigid diaphragms are present. | Not available. | Translational mass and mass moment of inertia (MMI) per diaphragm. |
| SAP2000 + Towers | Yes: in a table, for each story of each tower. | Yes: in a table, for each story of each tower, with pre-calculated eccentricities ex and ey. | Torsional radii, polar radii (radius of gyration), displacement sensitivity coefficients, story response tables, and charts. |
1. ETABS
In ETABS, the CR calculation is integrated directly into the analysis engine, presenting both centers in the same output table. This is the most direct approach among the three options.
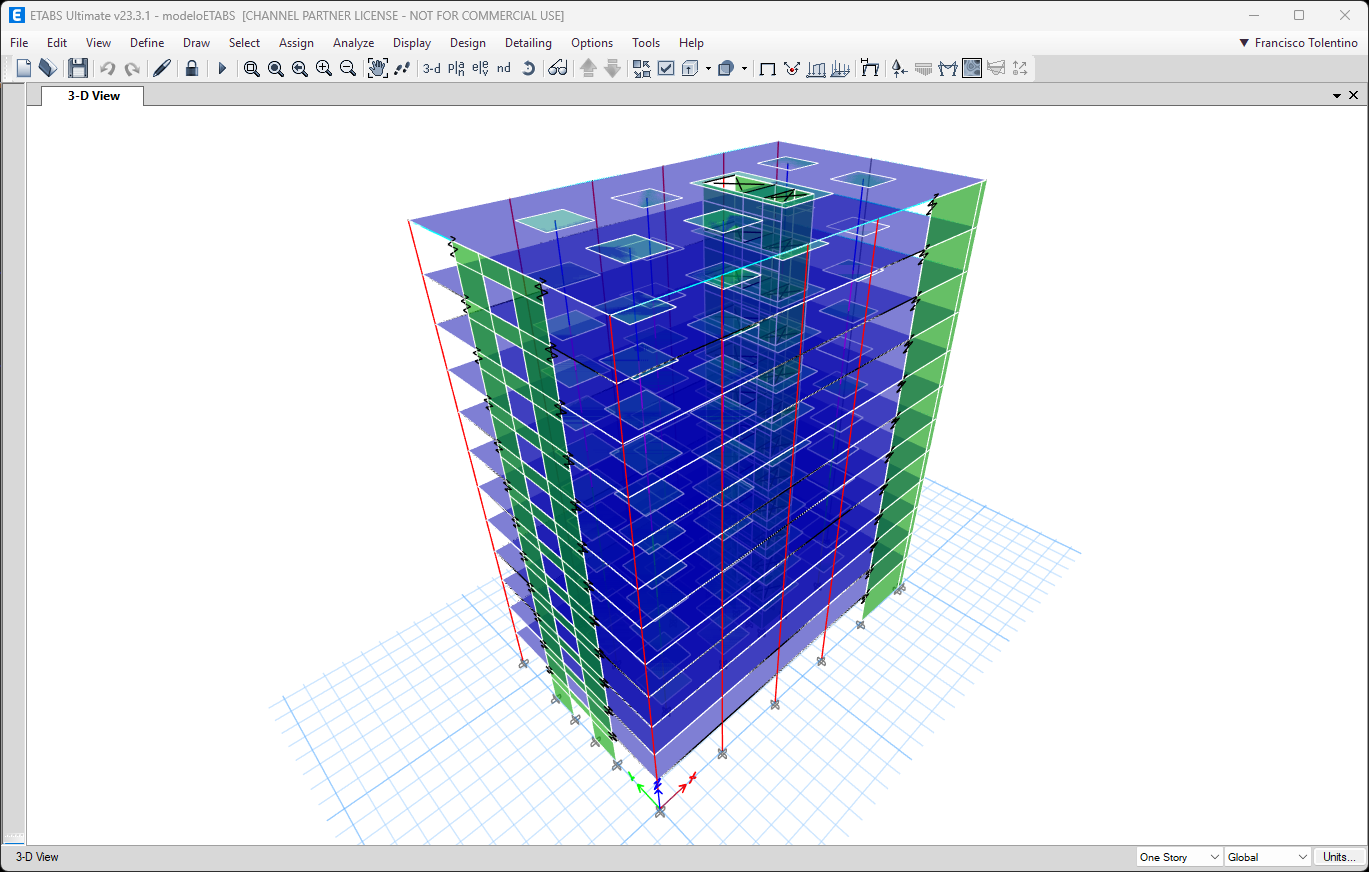
Figure 2: The building modeled in ETABS, with diaphragm D1 assigned to all stories.
1.1 Enabling the Calculation
Before running the analysis, verify that the center of rigidity calculation option is selected:
|
.png)
Figure 3: The Calculate Diaphragm Centers of Rigidity checkbox in the lower-left corner of the Set Load Cases to Run window must be checked before running the analysis.
This is the most common source of the complaint "ETABS doesn't give me the center of rigidity": the option is simply switched off and the columns come out empty.
1.2 Reading the Output Table
After running the analysis, access the results via:
|
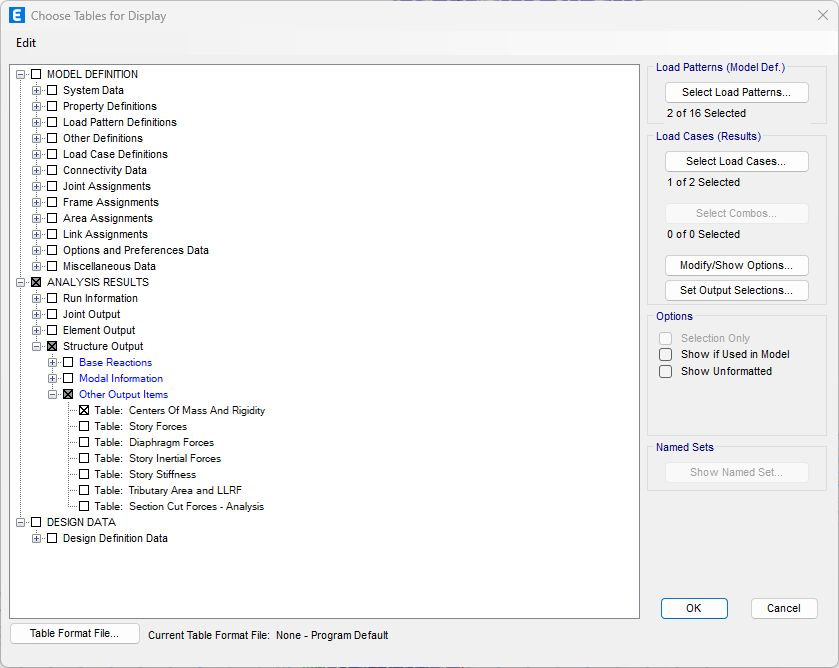
Figure 4: The Choose Tables for Display window, expanding Other Output Items with the Centers Of Mass And Rigidity table selected.
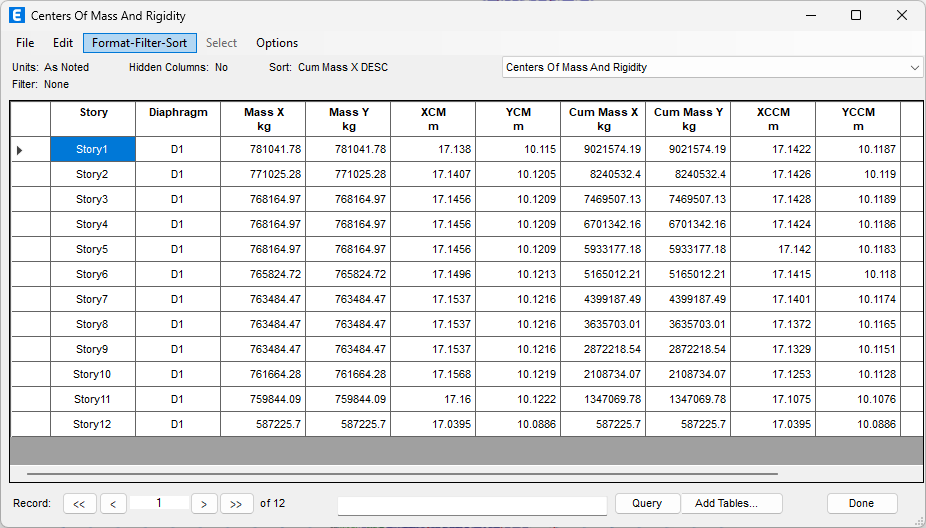
Figure 5: The Centers Of Mass And Rigidity table displaying story mass, center of mass, cumulative mass, cumulative center of mass, and center of rigidity in a single row per story.
The table provides the following values per story and diaphragm:
- Mass X / Mass Y: Story mass in each direction;
- XCM / YCM: Coordinates of the story center of mass;
- Cum Mass X / Cum Mass Y: Cumulative mass from the roof down to the current story;
- XCCM / YCCM: Center of mass of the cumulative mass, representing the centroid of all building mass above that level. This useful column indicates where the resultant inertia force acts above any given story;
- XCR / YCR: Coordinates of the center of rigidity.
Reviewing these values reveals a clear pattern: the center of mass remains virtually fixed across all 12 stories (XCM varies only between 17.138 m and 17.160 m from Story 1 to Story 11). Conversely, the center of rigidity shifts noticeably: YCR moves from 2.84 m at Story 1 to 6.31 m at the roof, while XCR shifts from 14.84 m to 13.16 m. This demonstrates that a building does not have a single center of rigidity: it varies story by story, making story-by-story EC8 compliance checks essential.
1.3 Two Scenarios Where ETABS Omits the CR
- Semi-rigid diaphragms: Due to the reasons outlined in the definitions section, CR is not a unique value and will not be displayed.
- Post-tensioned (PT) slabs: To accurately represent axial forces in tendons, ETABS internally removes rigid diaphragm constraints on levels containing tendons. Consequently, diaphragm mass, MMI, and CR are omitted from the output table for those levels, as the table lists only stories with active rigid diaphragm assignments.
2. Standalone SAP2000
In standalone SAP2000, the center of mass for each rigid diaphragm is readily available. However, the program does not compute or output the center of rigidity.
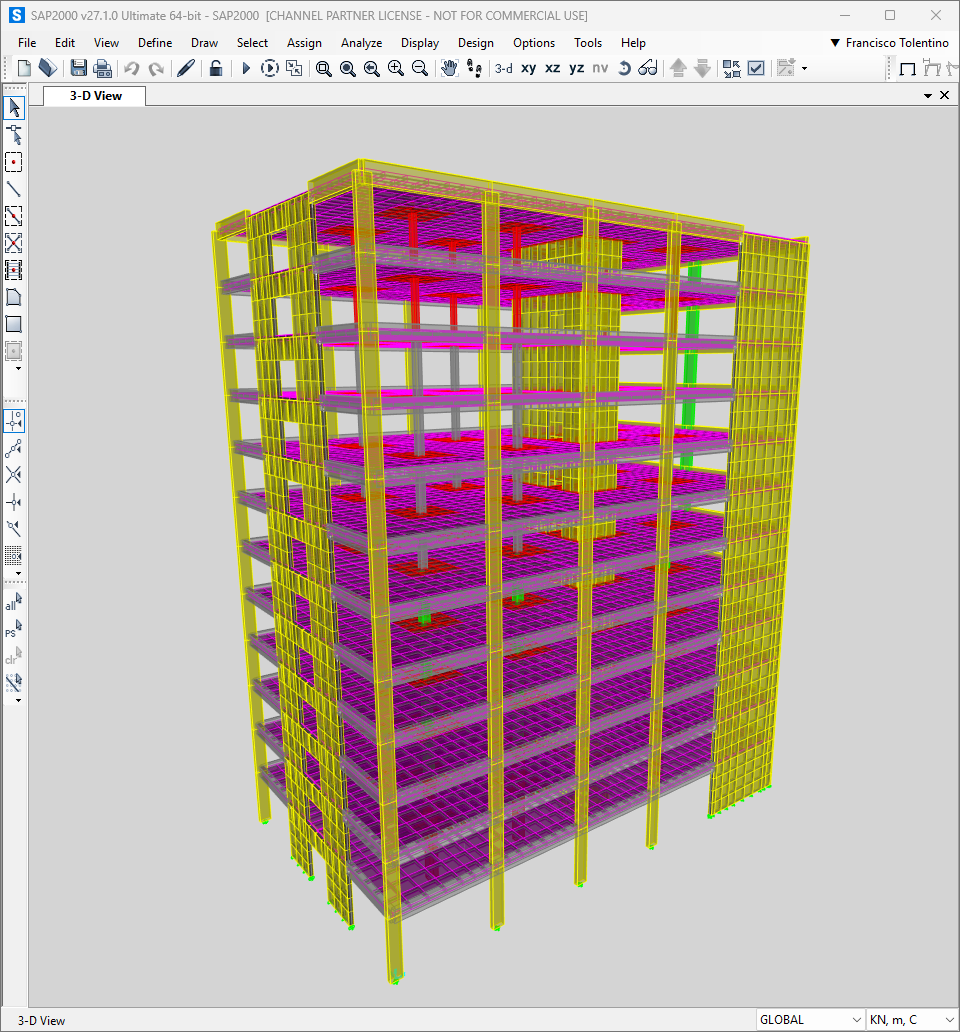
Figure 6: The building modeled in SAP2000, showing rigid diaphragm constraints assigned from D1_Story1 to D1_Story12.
An often overlooked feature is that SAP2000 automatically prints the center of mass coordinates for every rigid diaphragm into the .OUT file during model execution. No output tables or data exports are required—you can view them directly in any standard text editor.
Located in the model directory, this file shares the same base name as your .sdb file with a .OUT extension:
|
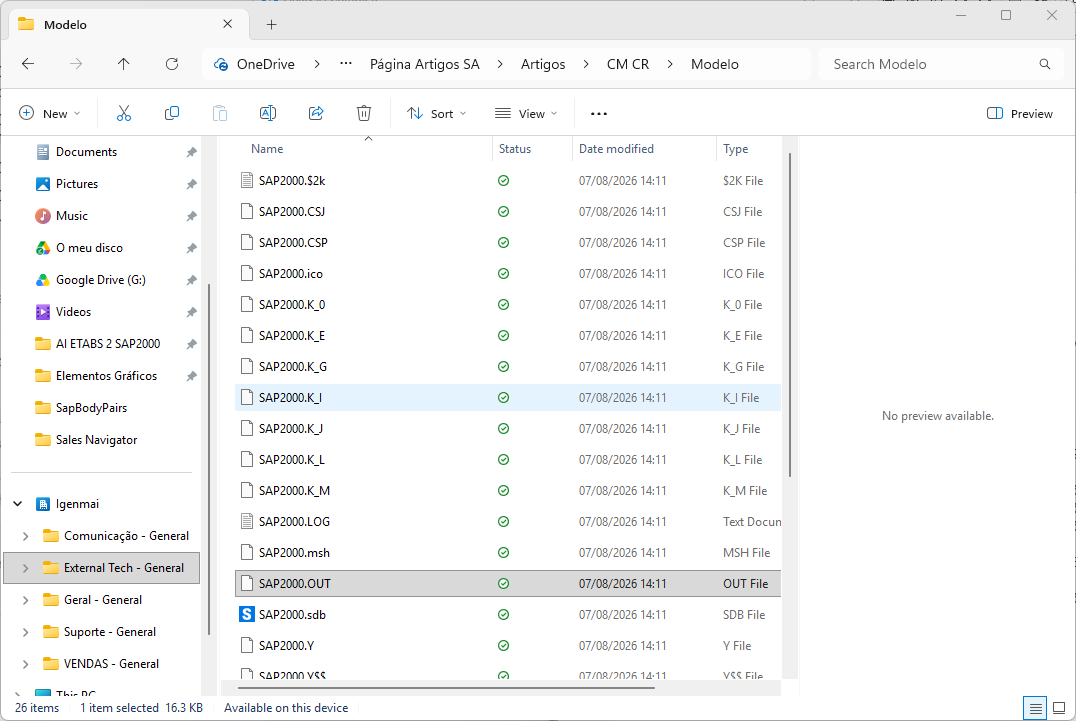
Figure 7: The .OUT file located alongside the .sdb file in the model directory, ready to open with Notepad or any text editor.
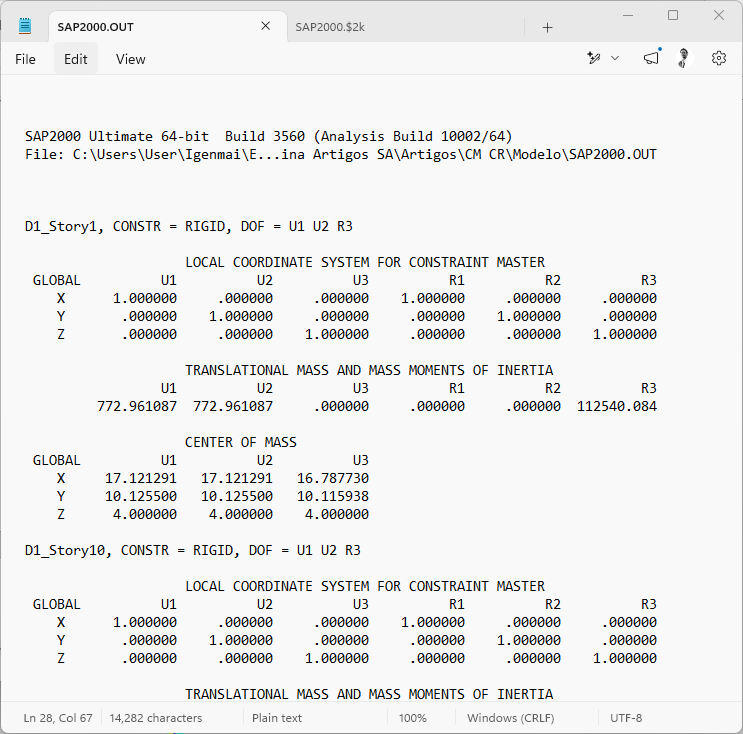
Figure 8: The output section for diaphragm D1_Story1, listing translational mass, mass moment of inertia, and center of mass coordinates.
Each section begins with the diaphragm label and constraint type (e.g., D1_Story1, CONSTR = RIGID, DOF = U1 U2 R3) and includes three primary data groups:
- Local coordinate system for constraint master node: Axis orientations for the diaphragm's master node;
- Translational mass and mass moments of inertia: Translational mass along U1 and U2, and polar mass moment of inertia around R3 (MMI);
- Center of mass: Global X, Y, and Z coordinates of the center of mass, listed separately for each mass degree of freedom (U1, U2, U3).
For standard design checks, focus on the U1 and U2 columns, which represent horizontal mass and share identical values. The U3 column corresponds to the vertical mass centroid and typically differs slightly; do not use U3 when evaluating plan eccentricities.
For this example model, the file contains data across all 12 stories (units: kN, m, C):
| Diaphragm | Z [m] | Mass U1 = U2 [t] | MMI R3 [t·m²] | XCM [m] | YCM [m] |
| D1_Story1 | 4.00 | 772.96 | 112,540 | 17.121 | 10.126 |
| D1_Story2 | 7.40 | 768.65 | 111,782 | 17.145 | 10.116 |
| D1_Story3 | 10.80 | 765.79 | 111,509 | 17.150 | 10.116 |
| D1_Story4 | 14.20 | 765.79 | 111,509 | 17.150 | 10.116 |
| D1_Story5 | 17.60 | 765.79 | 111,509 | 17.150 | 10.116 |
| D1_Story6 | 21.00 | 763.45 | 111,286 | 17.154 | 10.117 |
| D1_Story7 | 24.40 | 761.11 | 111,062 | 17.159 | 10.117 |
| D1_Story8 | 27.80 | 761.11 | 111,062 | 17.159 | 10.117 |
| D1_Story9 | 31.20 | 761.11 | 111,062 | 17.159 | 10.117 |
| D1_Story10 | 34.60 | 759.29 | 110,889 | 17.162 | 10.117 |
| D1_Story11 | 38.00 | 757.47 | 110,715 | 17.165 | 10.118 |
| D1_Story12 | 41.40 | 586.60 | 83,097 | 17.028 | 10.086 |
3. SAP2000 + Towers
Towers is a plugin developed by CSI Italia for SAP2000 (available separately from VIS) that introduces specialized multi-story building analysis features. Once installed, it launches directly from SAP2000's Tools menu, enabling center of rigidity calculations within the SAP2000 environment.
3.1 Defining Towers
The workflow begins by defining one or more "towers" in the plugin interface. Each tower represents a vertically continuous set of stories, accommodating complex structures with separate blocks or expansion joints. Tower definitions save directly into the model's .sdb file, so redefinition in future sessions is unnecessary.
For proper story definition, the model must have diaphragms assigned to slabs, as Towers relies on identified story levels and their associated masses for calculations.
3.2 Computing and Viewing Properties
Under the Towers properties group, clicking Calculate runs the calculation for each tower in the model, producing the following parameters per story:
- Centers of mass;
- Centers of rigidity;
- Torsional radii;
- Polar radii (mass radius of gyration);
- Displacement sensitivity coefficients, evaluating second-order (P-Delta) susceptibility.
The Settings dialog manages how calculations execute, with two options requiring careful attention:
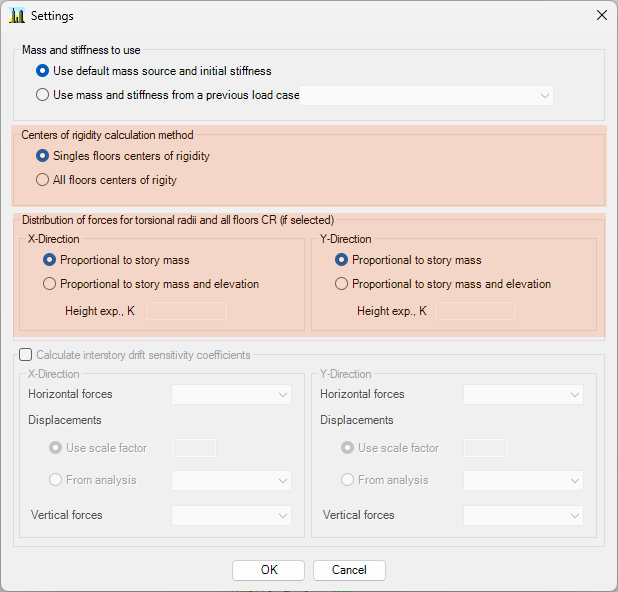
Figure 9: The Towers Settings window. The highlighted sections control the center of rigidity calculation method and the force distribution pattern used for torsional radii.
- Mass and Stiffness to Use: The default setting uses the mass source and initial stiffness, but parameters can also derive from a previous load case. This setting is useful when evaluating cracked or non-linear stiffness states instead of initial uncracked elastic conditions.
- Center of Rigidity Calculation Method: Single floors centers of rigidity calculates story CR independently by loading one floor at a time; All floors centers of rigidity loads the entire building simultaneously. The results reported below use the single floor method, matching code-mandated story-by-story checks.
- Force Distribution for Torsional Radii: When using the all-floors method for torsional radii, lateral forces can distribute proportionally to story mass, or to story mass and height using an exponent K, mimicking equivalent lateral force procedure profiles.
Once processing completes, open output tables via Display tables… or export data directly using Export to Excel.
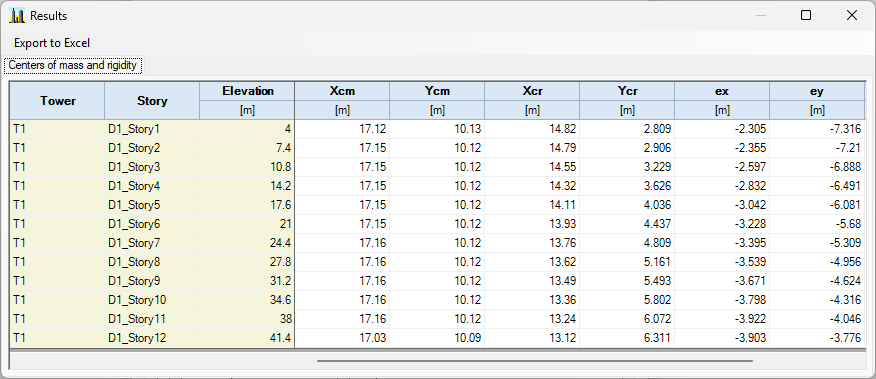
Figure 10: The Towers Centers of mass and rigidity table for all 12 stories, featuring automatically computed ex and ey eccentricities.
The output table reports elevation, center of mass coordinates (Xcm, Ycm), center of rigidity coordinates (Xcr, Ycr), and the resulting eccentricities ex and ey per story and tower (providing the exact e0 values needed to check 0.30·r limit criteria). Section 4 summarizes these results alongside ETABS and SAP2000 data.
Pre-calculated ex and ey values streamline review by eliminating manual subtraction steps. The results confirm the behavior seen in ETABS: while the CM stays in place, CR movement causes ey to decrease from −7.32 m to −3.78 m over the building height, while ex increases from −2.31 m to −3.90 m.
|
4. Value Comparison Across All Three Workflows
Comparing results from the same 12-story building model highlights how each tool performs. Standalone SAP2000 provides the center of mass extracted from its .OUT file, while ETABS and Towers deliver both structural centers.
| Story | XCM [m] | YCM [m] | XCR [m] | YCR [m] | ||||||
| SAP2000 | ETABS | Towers | SAP2000 | ETABS | Towers | ETABS | Towers | ETABS | Towers | |
| Story1 | 17.121 | 17.138 | 17.120 | 10.126 | 10.115 | 10.130 | 14.838 | 14.820 | 2.837 | 2.809 |
| Story2 | 17.145 | 17.141 | 17.150 | 10.116 | 10.120 | 10.120 | 14.754 | 14.790 | 2.908 | 2.906 |
| Story3 | 17.150 | 17.146 | 17.150 | 10.116 | 10.121 | 10.120 | 14.507 | 14.550 | 3.227 | 3.229 |
| Story4 | 17.150 | 17.146 | 17.150 | 10.116 | 10.121 | 10.120 | 14.274 | 14.320 | 3.624 | 3.626 |
| Story5 | 17.150 | 17.146 | 17.150 | 10.116 | 10.121 | 10.120 | 14.072 | 14.110 | 4.035 | 4.036 |
| Story6 | 17.154 | 17.150 | 17.150 | 10.117 | 10.121 | 10.120 | 13.899 | 13.930 | 4.439 | 4.437 |
| Story7 | 17.159 | 17.154 | 17.160 | 10.117 | 10.122 | 10.120 | 13.747 | 13.760 | 4.812 | 4.809 |
| Story8 | 17.159 | 17.154 | 17.160 | 10.117 | 10.122 | 10.120 | 13.602 | 13.610 | 5.152 | 5.148 |
| Story9 | 17.159 | 17.154 | 17.160 | 10.117 | 10.122 | 10.120 | 13.465 | 13.470 | 5.465 | 5.461 |
| Story10 | 17.162 | 17.158 | 17.160 | 10.117 | 10.122 | 10.120 | 13.340 | 13.350 | 5.758 | 5.754 |
| Story11 | 17.165 | 17.160 | 17.160 | 10.118 | 10.123 | 10.120 | 13.235 | 13.240 | 6.036 | 6.032 |
| Story12 | 17.028 | 17.025 | 17.030 | 10.086 | 10.090 | 10.090 | 13.162 | 13.160 | 6.310 | 6.306 |
 modeloETABS.$et