
Slender Tension-Only Braces in Response Spectrum Analyses in CSI Software
Slender braces are essential to the lateral stability of many steel structures. However, when these members work in tension only, a conceptual incompatibility arises between their behavior and the assumptions underlying response spectrum analysis.
Response spectrum analysis assumes constant stiffnesses, yet these braces exhibit different stiffnesses depending on the direction of the seismic action — a nonlinear behavior that does not fit directly within this type of analysis.
This article presents a simple methodology to overcome this limitation, based on the creation of equivalent linear sub-models derived from preliminary nonlinear analyses. The approach is natively supported by CSI software (SAP2000, ETABS, and CSiBridge), which makes it practical and effective for routine seismic design of structures with slender braces.
1. The challenge of tension-only braces
A slender brace working exclusively in tension:
- has axial stiffness EA/L when in tension;
- loses virtually all stiffness when subjected to compression.
Therefore, depending on the direction of the seismic action, the same brace may be active in one case and inactive in the opposite case.
This variation in stiffness is a nonlinear behavior and, as a result, cannot be represented directly in a response spectrum analysis, which assumes constant stiffness during the modal evaluation.
This is where the creation of equivalent linear models comes in — one for each relevant direction of the seismic action.
2. Core idea of the methodology
The solution is to build, for each relevant direction of the seismic action, an equivalent linear model that represents the actual state of the structure in that direction — that is, a model in which only the effectively tensioned braces contribute to the stiffness. These models are generated in four steps:
- Apply fictitious lateral loads representing each direction of the seismic action.
- Run nonlinear analyses with Tension/Compression Limits, which automatically activate the tensioned braces and cancel the stiffness of the compressed ones.
- Create modal cases based on the final stiffness obtained from those analyses.
- Use those modal cases as the basis for the corresponding response spectrum analyses.
Each linear model obtained in this way is valid for one direction of the seismic action. The number of models required depends on the layout of the braces in the building:
For braces in one direction:
- H+
- H-
For braces in two orthogonal directions:
- HX+, HX-
- HY+, HY-
3. Building the models with Tension/Compression Limits
Step 1 — Fictitious lateral loads
Arbitrary horizontal load cases are created in the directions of interest.
The sole purpose is to induce tension in one set of braces and compression in the other.
Step 2 — Very simple nonlinear analyses
With T/C limits:
- members in tension retain their full axial stiffness;
- members in compression take on virtually zero stiffness.
The final tangent stiffness of each element is stored.
Step 3 — Creation of the modal cases
Each nonlinear analysis represents the structural state for a given direction of the earthquake.
Modal cases are created based on the final stiffness from those nonlinear cases.
Step 4 — Response spectrum analyses
Each modal case is used in an independent response spectrum analysis.
The software combines the modes internally (SRSS/CQC), as in any response spectrum analysis.
4. Example of a 2D frame (simplified model)
The attached model example, inspired by exercise 31 of the Advanced SAP2000 course, uses a 2D frame with X-shaped diagonal braces, so only two cases are required:
- H+
- H-
Procedure:
- Fictitious loads H+ and H-.
- Nonlinear analyses with T/C limits.
- Modal cases with the final stiffness from each analysis.
- Two independent response spectrum analyses.
In the attached model these steps are already set up, which makes it possible to assess the methodology by comparing the results of the two response spectrum analyses (RS_H+ and RS_H-) with a reference nonlinear Time-History analysis, presented further below.
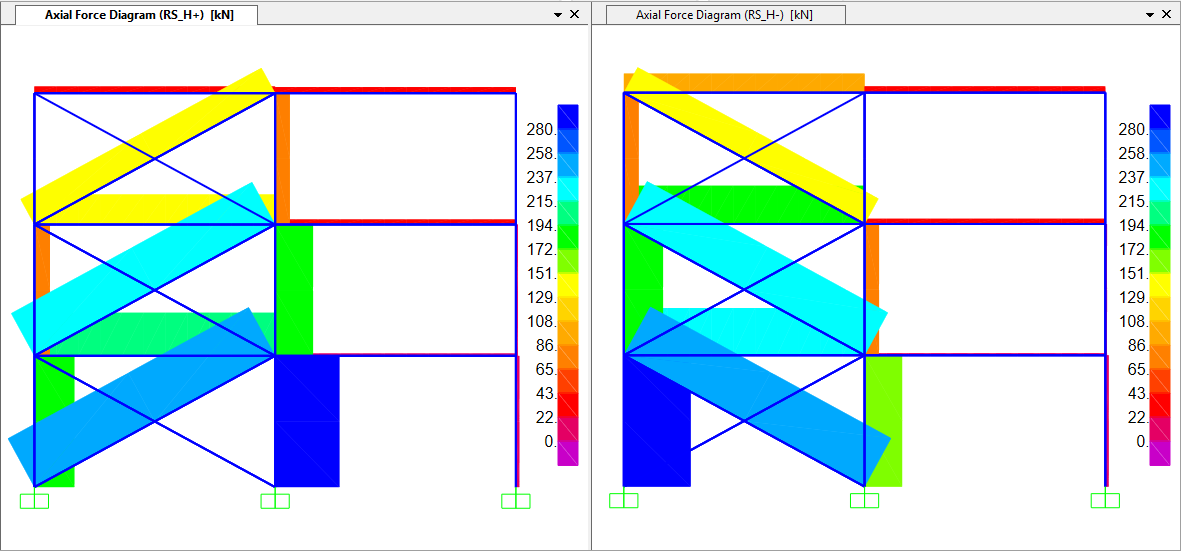
The following figure shows, side by side, the axial forces in the braces for each of the response spectrum analyses. It is clear that each analysis activates only the diagonals in tension for the corresponding direction — the others remain inert, with zero force — confirming that the sub-models are correctly configured for the direction they represent:
It remains to be seen whether the envelope of these two response spectrum analyses faithfully reproduces the nonlinear response of the structure. To assess this, we use a nonlinear direct-integration Time-History analysis as a reference: unlike the RS analyses, it explicitly captures the activation and deactivation of the braces over time. The acceleration time history used was previously matched to the response spectrum of the RS analyses — an adjustment performed directly in SAP2000, a feature also available in the other CSI programs.
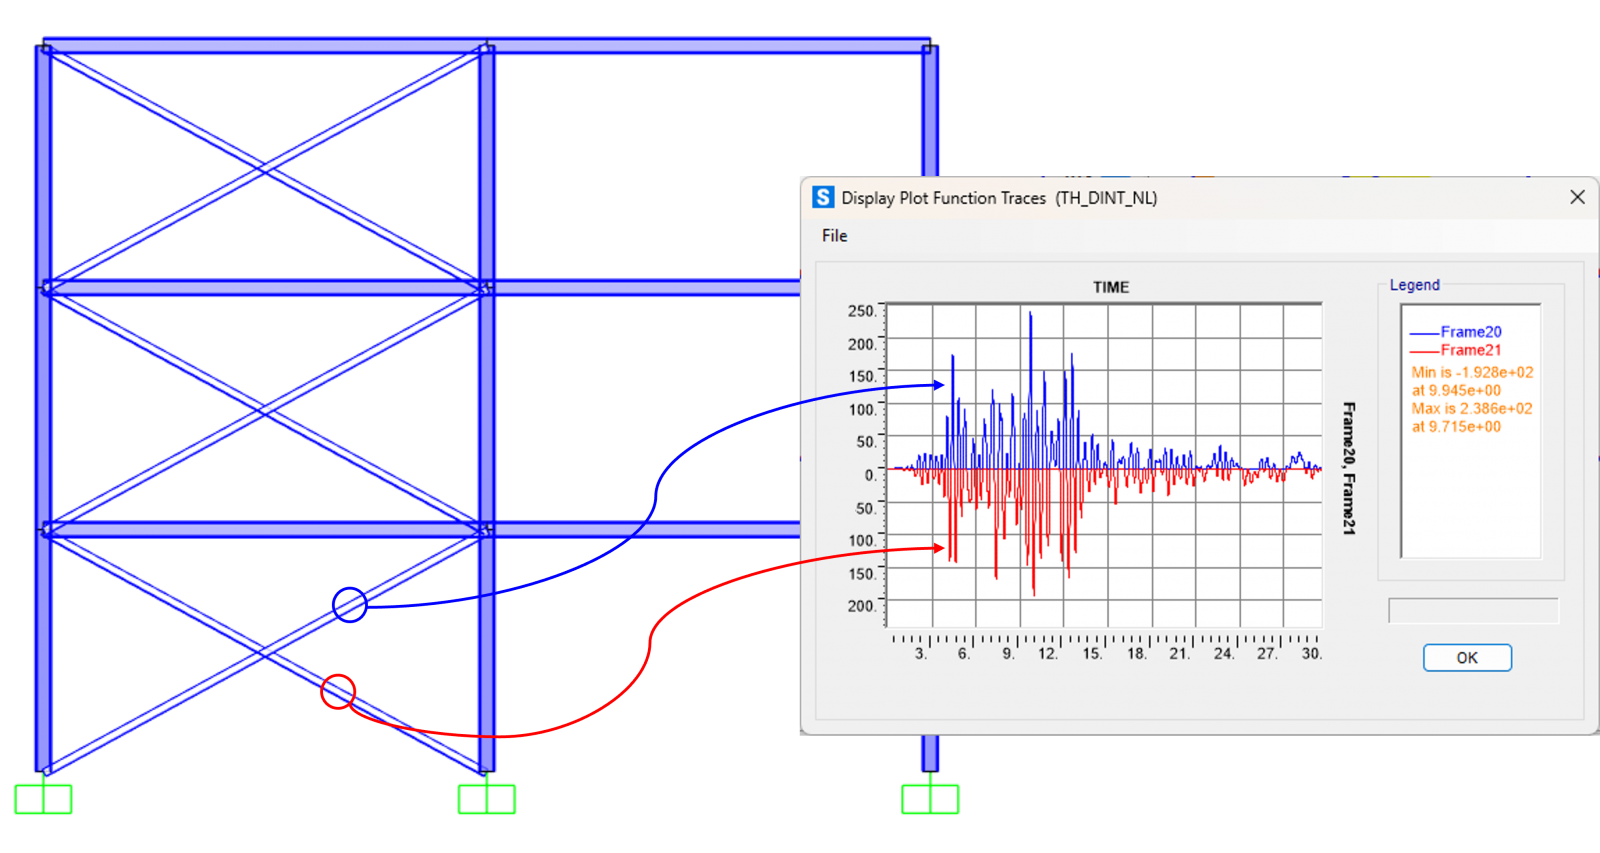
Although a single acceleration time history contains accelerations of both signs and therefore mobilizes both sets of diagonals over time, the peak force in one diagonal does not generally coincide with the peak in its mirror counterpart. Because the original acceleration time history and its sign-reversed version match the same response spectrum, the analysis was run with both, ensuring a fair comparison against the RS envelope. We start with the original acceleration time history, focusing on the axial forces in the lower-story braces:
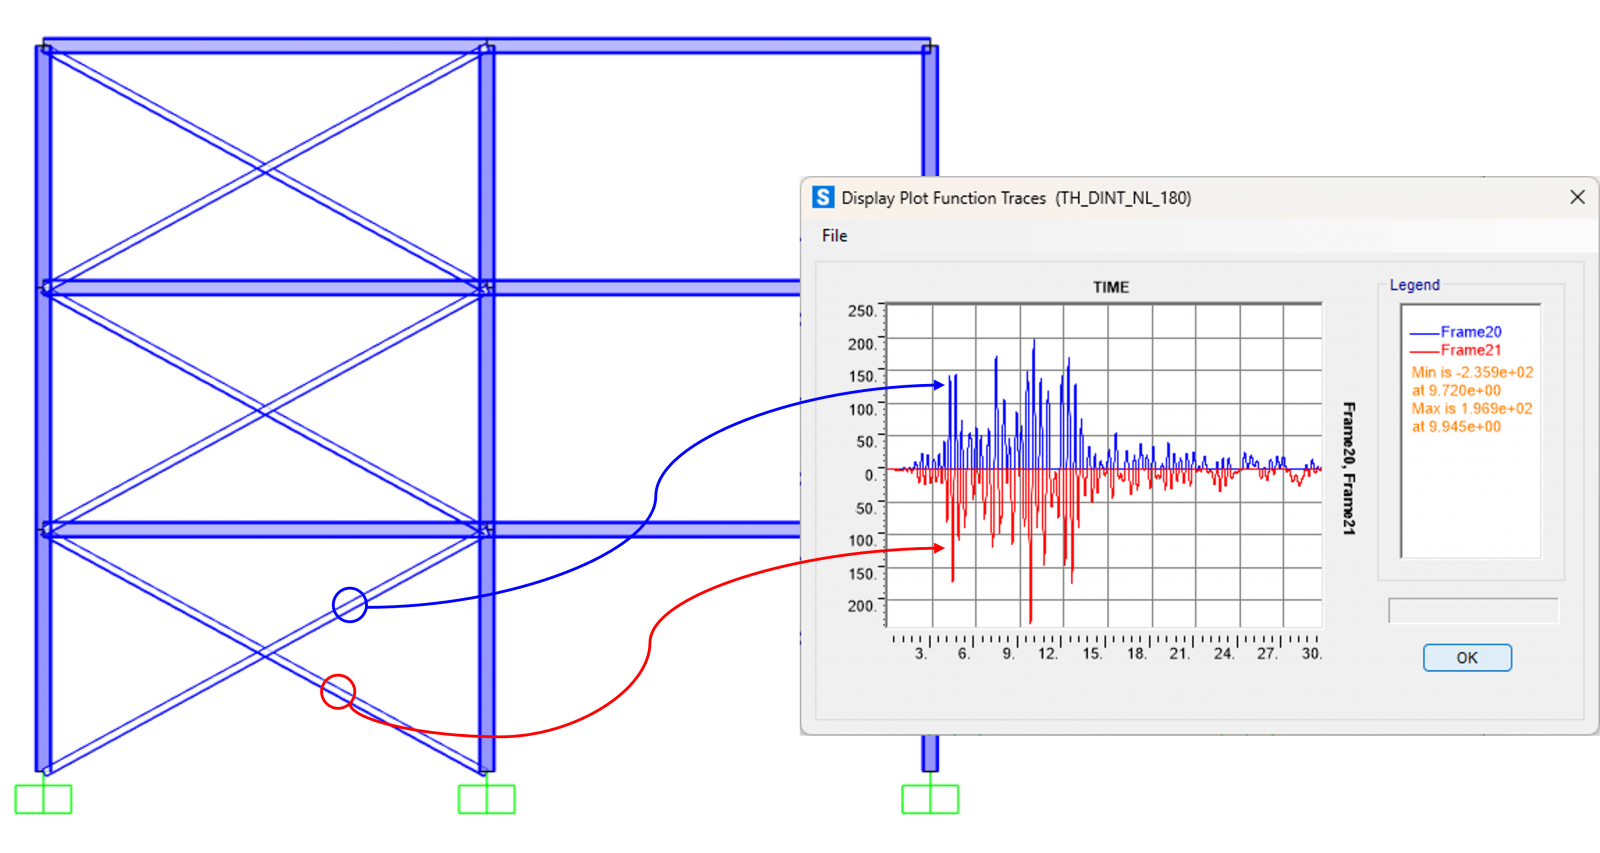
And then with the sign-reversed acceleration time history (same time series with the sign inverted), in which the peak force now occurs in the opposite set of diagonals:
Comparing the maximum value in the braces between the envelope of the two RS analyses and the envelope of the two TH analyses (X+ and X-), the difference is approximately 7%:
RS: 252.9 kN (envelope)
TH: 235.9 kN (envelope)
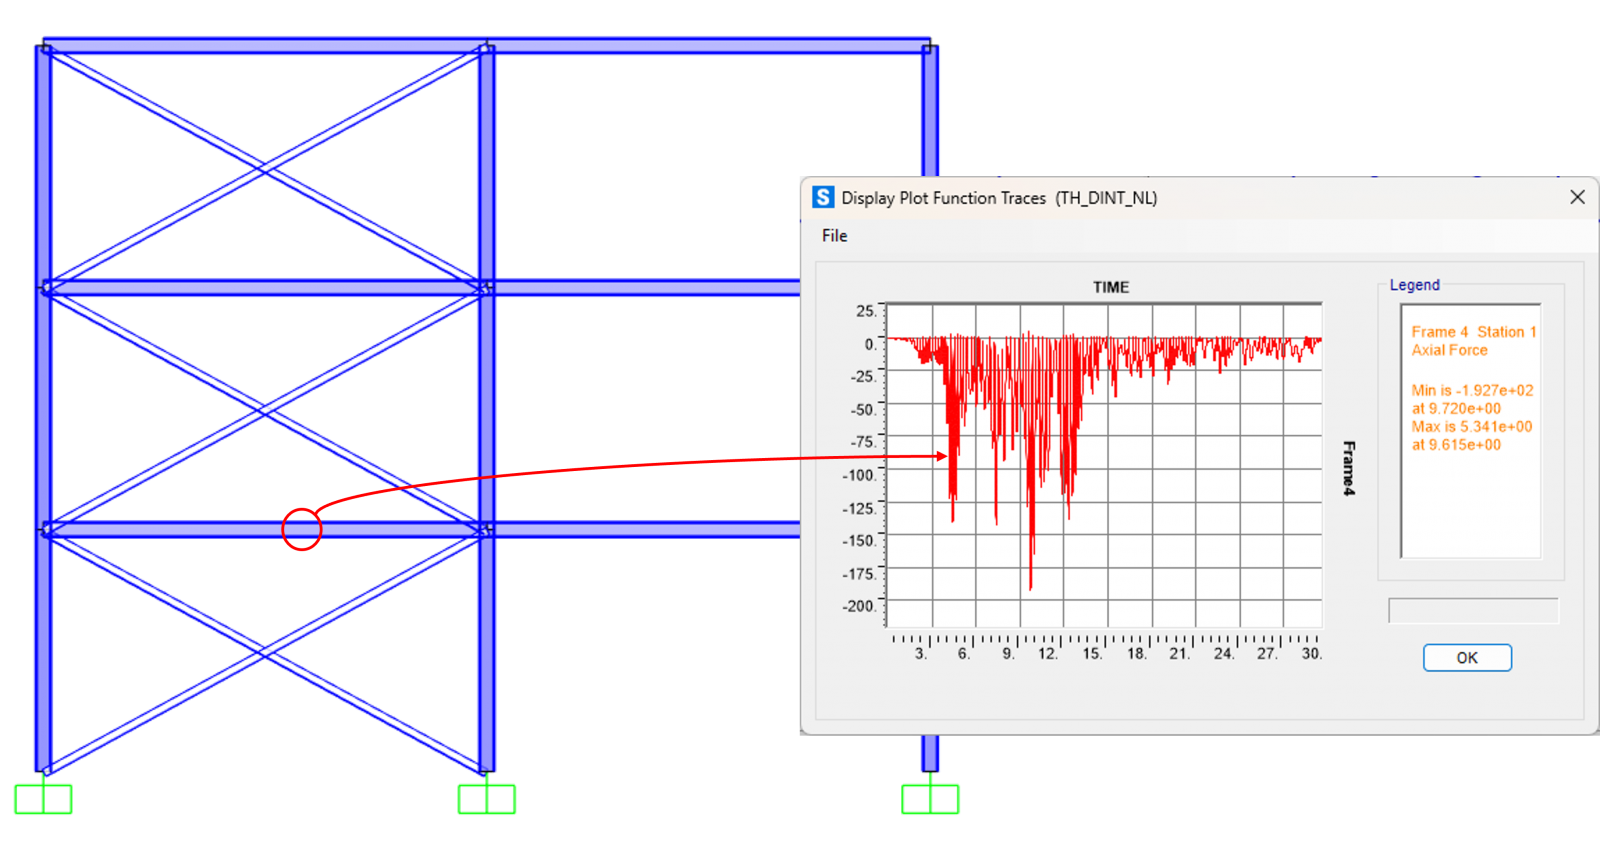
The same comparison can be made for the lower-story transfer beam — a particularly interesting element for validating the methodology, since it collects the horizontal forces transmitted by the active braces. The following figures show the axial forces in this beam for each direction of the TH, comparing them with the corresponding RS. For X+:
And for X-:

Here too the RS and TH envelopes are very close, with a difference of approximately 6%:
RS: 216.1 kN (envelope)
TH: 203.7 kN (envelope)
In both the braces and the transfer beam, the envelope of the response spectrum analyses run on the equivalent linear sub-models reproduces with good accuracy the response captured by a nonlinear direct-integration analysis. The methodology thus offers the simplicity of linear analysis without losing fidelity to the actual behavior of the structure.
5. Structures with braces in X and Y
When braces are present in two orthogonal directions, the procedure is the same — the cases are simply doubled, leaving four directions to consider:
- HX+
- HX-
- HY+
- HY-
Each of these four cases yields its own linear model, generated by the same procedure described in chapter 3. The four corresponding response spectrum analyses cover every stiffness configuration relevant to the structure.
6. Conclusion
Using slender tension-only braces in response spectrum analyses is viable, provided that we respect the need to create equivalent linear sub-models representative of the stiffnesses active in each loading direction.
With minimal preparation (2 or 4 preliminary nonlinear analyses), we obtain:
- correct modal models,
- consistent responses,
- and results aligned with more complete nonlinear analyses.
This approach is practical, transparent, and widely used in real projects. It is what we recommend for the seismic design of structures in which the compressed diagonal braces offer no resistance, and its ease of implementation in the CSI programs makes it particularly attractive for routine use in design.
Note — Hook Links
In the original example from the Advanced SAP2000 course, the braces were modeled as Hook Links rather than frame members with T/C Limits. That approach is useful when one wants to capture nonlinear behavior in nonlinear Modal Time-History analyses (FNA), in which the nonlinear elements must be links. For the type of analysis discussed in this article — response spectrum supported by preliminary nonlinear static analyses — using frame members with T/C Limits is the most practical and direct approach, owing to its simplicity and conceptual clarity.